Showing posts with label Facts and figures. Show all posts

Tuesday, 12 May 2015

The Generational Content Gap infographic

Depending on which generation you belong, you consume content differently. So, when you make content it's very important to know who your target is.

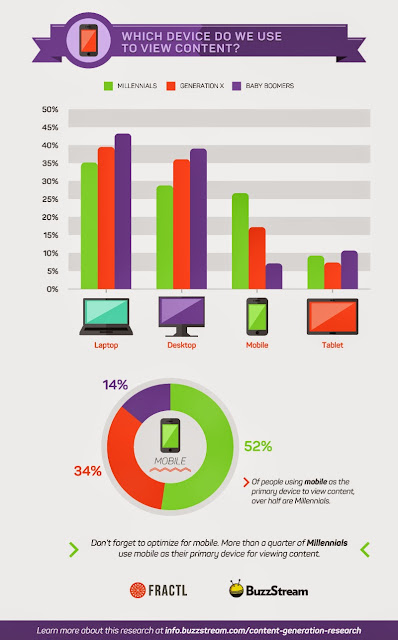
This infographic, based on a survey of BuzzStream and Fractl is clearly showing the diversity among age groups.

The data are from 1200 people from three generations - Millennials (people who born in between 1981-1997), Generation X (born 1965-1980), and Baby Boomers (born 1946–1964).

Key takeaways:

Quantity: Baby Boomers consume 15-20 hours per week. Gen X and Millennials consume 5-10 hours.
Time: Late Evening, (08 PM to 11:59 PM) for all generations, so posting at that time is a good idea.
Device: Laptops are the first choice. Then PCs. Over 25% of Millennials use mobile as their primary device. Make sure that your site is responsive Don't forget to optimize for mobile. More than a quarter of Millennials use mobile as their primary device for viewing content.
Length: 300 words are the desired length for all generations.
Platform: Facebook is the king.
Visual: Images are the most shared visual content.
Genres: Each generation has their own unique preferences. Baby Boomers consume world news and politics. Millennials are first in technology. Gen Xers are first in healthy living and personal finance.

the-generational-content-gap

the-generational-content-gap

the-generational-content-gap

the-generational-content-gap

the-generational-content-gap

the-generational-content-gap


via

Monday, 20 October 2014

Digital Strategy Toolbox 2014 by Julian Cole

Two year ago I've posted a presentation from Julian Cole, with the tools that digital strategist should use to cultivate killer insights on consumers, competitors and the industry. Now, Julian Cole is back with an updated Digital Strategy Toolbox that covers the 19 best free tools online.

The tools are broken up in to five categories of Consumer Research, Social, Website, Online Paid Media and Creative Inspiration.


Tuesday, 29 April 2014

Erik Qualman: #Socialnomics 2014

The Socialnomics video series by Erik Qualman is back. The mind-blowing facts include grandparents as the fastest-growing demographic on Twitter, the 20% of daily searches on Google are never searched before, the millennials, online dating and more.

Erik Qualman: #Socialnomics 2014


Credits:
The video was produced by Equalman Studios.

Monday, 31 March 2014

All Facebook Image Dimensions infographic

A very useful infographic by Jon Loomer with all the dimensions you need in order to optimize your Facebook timeline, posts and ads.

facebook image dimensions timeline newsfeed posts ads All Facebook Image Dimensions: Timeline, Posts, Ads [Infographic]
Courtesy of: JonLoomer.com

Thursday, 23 January 2014

How to Increase Your Pinterest Engagement by 275% (infographic)

With 70.000.000 users, you can't afford to ignore Pinterest. So let's see how you could increase engagement with this helpful infographic from Neil Patel.


Monday, 13 January 2014

Global Digital Statistics 2014 presentation

The reports from We Are Social Singapore are always a great read. This report presents all the key statistics, data and behavioural indicators for social, digital and mobile channels around the world.

We Are Social - Global Digital Statistics 2014


Friday, 20 December 2013

Google Zeitgeist: Here's to 2013

Google Zeitgeist 2013 gives us the top search terms for the year. You can look at the top 10 charts about people, events, athletes, movies, consumer electronics, etc, here. There is also an interactive 3d trends globe

Google Zeitgeist 2013


Tuesday, 17 December 2013

Soap: Digital Predictions 2014

Every year Soap makes its digital, advertising, social and tech predictions. Some of them are meet some of them are not, but always are worth reading. If you want to know what they predicted last year click here

Soap digital predictions 2014


Monday, 18 November 2013

Mobile is eating the world

A presentation full of useful facts about the mobile ecosystem.

Mobile is eating the world presentation by Benedict Evans


Tuesday, 17 September 2013

15 Facebook amazing statistics

With 1,15 million users and counting, you come to expect that every Facebook number will be huge but still the stats are too impressive. The following infographic by Dashburst presents 15 amazing facts, like the staggering 240 billion total uploaded photos and the 350 million photos uploaded each day. A company with $5,09 billion revenue in 2012 has only 4.619 employees. That is impressive.


Thursday, 25 July 2013

What happens online in 60 seconds

A 2013 version of a well known type of infographic. It is always impressive to see what happens online in just 60 seconds.


via

Friday, 19 July 2013

Braun or Apple?

So much for Apple's innovative design. It seems that they got their inspration from Braun. The iPod is based on Braun T3 Pocket Radio, the Powermac G5 PRO is the same as Braun T1000 Radio and the list goes on. The following infographic makes it crystal clear.


Monday, 15 July 2013

Bud Caddell: Digital Strategy 101

What is digital strategy? Bud Caddell explains thgough this great presentation the current state of digital strategy and explores core concepts and deliverables. 

Monday, 8 July 2013

The Evolution of Advertising: How Consumers Won the War for Their Attention

An epic must-read presentation by HubSpot. You'll get through the 472 slides easily in this exciting trip in history and evolution of advertising. Start reading...


Tuesday, 2 July 2013

Brian Solis and JESS3: The Conversation Prism 2013

Here is version 4 of Brian Solis' Conversation Prism, the visual map of the social media landscape. From the 1st Conversation Prism in August 2008 until now a lot of things have changed. The emerging social media landscape was visualised in a flower-like chart and now it's transformed into a kaleidoscope. So, if you still think that social media is Facebook, YouTube, Twitter, and Pinterest, you should study the new Conversation Prism.

Brian Solis and JESS3 Conversation Prism v4

via

Friday, 7 June 2013

SIX inc: a New Creative Engagement Agency by Hakuhodo

Digital Agency Hakuhodo was the first-ever Japanese agency to be named “The Most Awarded Agency in Digital in the World” in The Gunn Report 2012.

SIX inc. was founded by six creative directors of Hakuhodo: Takashi Nozoe, Tsubasa Oyagi, Keiichi Motoyama, Taku Tsuboi, Jin Saito and Takayuki Hino.


Corporate logo design: StormStudios&Peter Curzon

Their vision is “to create a new bond between brand and users.” Each letter of “SIX” stands for their values towards creativity: S for “SYNC” to manifest synchronicity with the times; I for “IGNITE,” to give inspirations or stimulate emotions; and X for “EXPLORE,” to go on an endless journey to open new dimensions of communication. The name “SIX” is derived from various elements including the “small-world phenomenon,” the principle that any two individuals can be connected in a maximum of six steps; the “sixth sense,” the extrasensory perception that goes beyond the five senses; and the “six days of creation,” that God created the universe in six days.

We are all familiar with their incredile work. Just a few examples...


View more at http://sixinc.jp/work/ 

Thursday, 30 May 2013

Facebook Wall Post Cheat Sheet to Increase Interaction

Insightful infographic about wall post that work best.


Monday, 20 May 2013

We Are Social: Future Factors 2013

Another great presentation on Social Trends from We Are Social Singapore.

Thursday, 7 February 2013

Social, Digital, Mobile Worldwide Feb 2013

The latest global facts on digital, social, mobile from We Are Social shows the growth on all indicators. Very interesting read.


Monday, 14 January 2013

Soap: Digital Predictions 2013

Each year Soap Creative makes a list of digital predictions. For 2013 they made the top 13 which includes crowd funding, e-commerce2.0, smart-ass objects, 3d printing and more. They manage to get a good score at the end of each year so don't take it lightly. Check also Soap's funny and insightful presentation on Facebook user types.

Related Posts Plugin for WordPress, Blogger...